Candlestick Patterns Cheat Sheet: 24 Patterns, What They Mean and When They Fail
Candlestick patterns are short sequences of candles that show a shift between buyers and sellers. Here are the 24 worth knowing: a diagram for each, what it usually means, and the part most cheat sheets skip, when it fails.
Candlestick patterns are short sequences of candles showing a shift between buyers and sellers. The core set is around 24 patterns: single-candle (hammer, doji), two-candle (engulfing, harami) and three-candle (morning star). Context decides everything, because the same pattern means little away from a level or against the trend.
Open EURUSD on the H4 in our charting desk and look for it on real, current price - the same thing this page describes, on a chart that is moving. It is a free preview of the real desk, and a free guest account is required to open it: put in your email, we send a login code, and you are on a live chart in under a minute. The preview runs real market data with one indicator at a time - nothing is saved and no broker is connected. A preview of the product, not advice.
Open the live chart →All 24 patterns at a glance
Tap any pattern for its full lesson. Dim candles are the context; bright candles are the pattern.
🖶 Print this cheat sheet ⬇ Download as an image
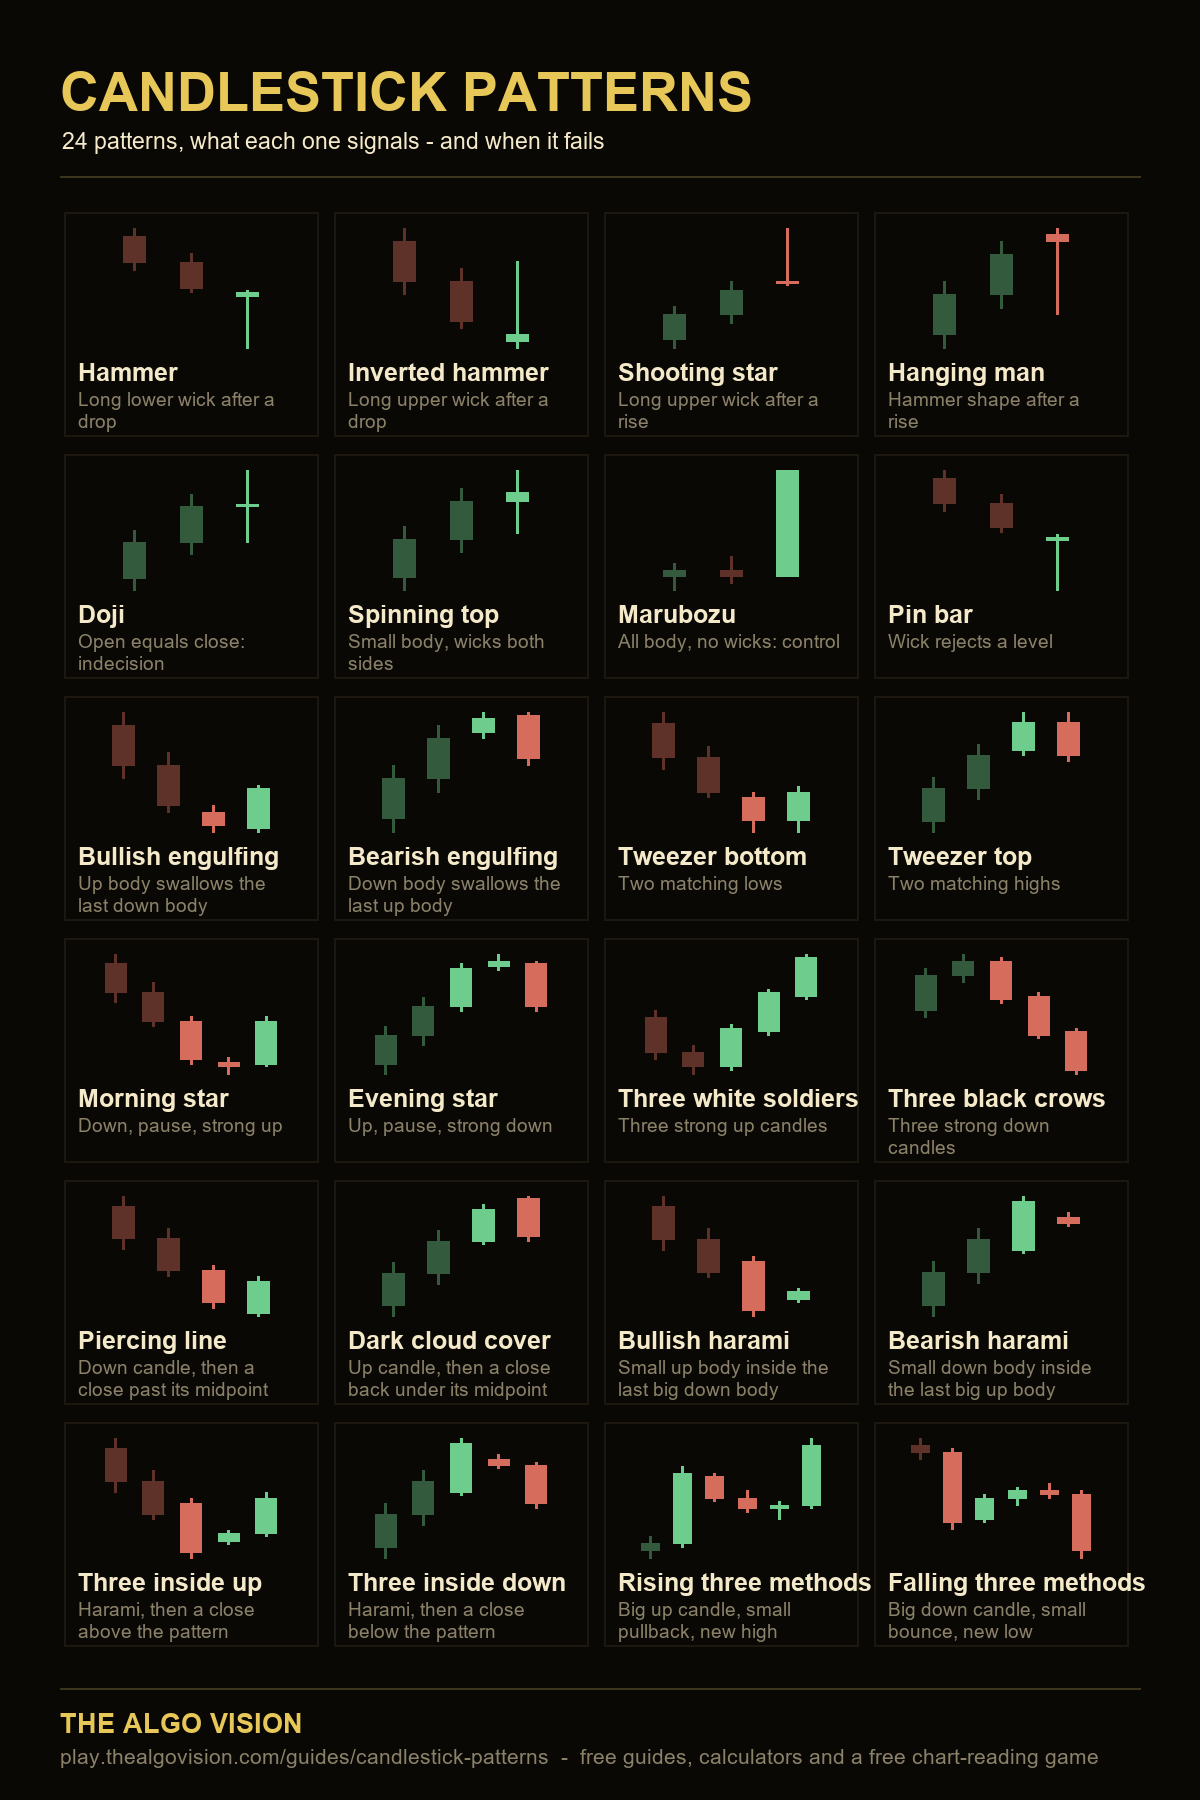
The image is one page with all 24 patterns — save it to your phone, pin it, or drop it in your trading group. Printing gives you a clean black-on-white version with every diagram and no menus.
Single-candle patterns
| Pattern | Looks like | Usually read as |
|---|---|---|
| Hammer | Small body at the top, long lower wick, after a decline | Sellers pushed down, buyers rejected it (bullish) |
| Inverted hammer | Small body at the bottom, long upper wick, after a decline | Buyers tested higher, possible turn (needs confirmation) |
| Shooting star | Small body at the bottom, long upper wick, after a rise | Rally rejected (bearish) |
| Hanging man | Hammer shape after a rise | Warning of selling pressure (bearish, needs confirmation) |
| Doji | Open and close almost equal | Indecision |
| Spinning top | Small body, wicks both sides | Indecision, momentum fading |
| Marubozu | Full body, little or no wick | Strong one-sided control |
| Pin bar | Long wick rejecting a level | Rejection of that price |
Two-candle patterns
| Pattern | Looks like | Usually read as |
|---|---|---|
| Bullish engulfing | Up candle's body fully covers the prior down body | Buyers took control (bullish) |
| Bearish engulfing | Down candle's body fully covers the prior up body | Sellers took control (bearish) |
| Tweezer bottom | Two candles with matching lows | Level defended twice (bullish) |
| Tweezer top | Two candles with matching highs | Level rejected twice (bearish) |

Knowing the names is easy; spotting them in a live chart is the skill. Chart Bound's creatures and trials are built around these exact candles.
Play free, no signup →Three-candle patterns
| Pattern | Looks like | Usually read as |
|---|---|---|
| Morning star | Big down candle, small candle, big up candle | Selling exhausted, reversal up |
| Evening star | Big up candle, small candle, big down candle | Buying exhausted, reversal down |
| Three white soldiers | Three strong up candles in a row | Sustained buying |
| Three black crows | Three strong down candles in a row | Sustained selling |
Reversal-confirmation and continuation patterns
| Pattern | Looks like | Usually read as |
|---|---|---|
| Piercing line | Down candle, then a close back above its midpoint | Buyers reclaiming (bullish) |
| Dark cloud cover | Up candle, then a close back under its midpoint | Sellers reclaiming (bearish) |
| Bullish harami | Small up body inside the last big down body | Selling pressure shrinking |
| Bearish harami | Small down body inside the last big up body | Buying pressure shrinking |
| Three inside up | Bullish harami plus a confirming close above it | Confirmed turn up |
| Three inside down | Bearish harami plus a confirming close below it | Confirmed turn down |
| Rising three methods | Big up candle, shallow pullback inside it, new high | Uptrend continuing |
| Falling three methods | Big down candle, shallow bounce inside it, new low | Downtrend continuing |
Every pattern in detail
One entry per pattern: what it is, when it fails (the half most cheat sheets leave out) and how to actually use it.
Hammer
Long lower wick after a drop
What it is. Sellers drove price down during the candle and buyers pushed it all the way back, leaving a long lower wick. It reads as rejection of lower prices.
When it fails. In a strong downtrend a hammer is often just a pause. It fails most when it forms mid-range with no level under it, and when the next candle closes below its low.
How to use it. Wait for the next candle to close above the hammer's high, and take it only where price is reacting to a level you marked in advance.
Inverted hammer
Long upper wick after a drop
What it is. Buyers pushed well above the open before giving it back, after a decline. It hints that buyers are testing higher.
When it fails. On its own it looks identical to a shooting star. Without a bullish close after it, it usually resolves lower.
How to use it. Treat it as a warning to watch, not an entry. Confirmation is the whole trade.
Shooting star
Long upper wick after a rise
What it is. A rally rejected: price ran up and closed back near the open, leaving a long upper wick.
When it fails. It fails when the trend is strong and buyers keep absorbing; a close above the wick's high invalidates it.
How to use it. Strongest at a prior high or a level where price already turned once.
Hanging man
Hammer shape after a rise
What it is. The same shape as a hammer but after a rise, warning that sellers are appearing.
When it fails. It is the weakest of the reversal candles on its own and frequently just precedes more upside.
How to use it. Only act with a bearish close after it, ideally at resistance.
Doji
Open equals close: indecision
What it is. Open and close finish in nearly the same place: neither side won the period.
When it fails. Indecision is common; in a quiet range dojis mean nothing at all.
How to use it. Useful where it appears: a doji after a long run, at a level, says momentum has stalled.
Spinning top
Small body, wicks both sides
What it is. A small body with wicks both sides: price moved around and settled near where it started.
When it fails. Fails as a signal in chop, where most candles look like this.
How to use it. Read it as fading momentum inside a trend, not as a reversal by itself.
Marubozu
All body, no wicks: control
What it is. A full body with almost no wick: one side controlled the entire period.
When it fails. Often marks the end of a move rather than the start, especially after an extended run.
How to use it. Use it as evidence of strength for continuation, and respect its extreme as a level.
Pin bar
Wick rejects a level
What it is. A long wick sticking out of surrounding price, showing a level was tested and rejected.
When it fails. A pin bar that sticks into empty space, not a level, has no meaning.
How to use it. Mark the level first. The pin bar only confirms what the level already told you.
Bullish engulfing
Up body swallows the last down body
What it is. An up candle whose body fully covers the previous down body: buyers took over decisively.
When it fails. It fails when it forms into resistance, or when the engulfing candle is enormous and the entry is far from any stop.
How to use it. Best at support after a clean sweep of a low, with the stop under the pattern.
Bearish engulfing
Down body swallows the last up body
What it is. A down candle whose body fully covers the previous up body: sellers took over.
When it fails. Fails into a strong uptrend and at obvious support, where buyers reload.
How to use it. Look for it at a prior high or into a level, with the stop above the pattern.
Tweezer bottom
Two matching lows
What it is. Two or more candles with matching lows: the same price was defended twice.
When it fails. Matching lows in a downtrend often break on the third test.
How to use it. Combine with a bullish close; the defended low becomes the stop.
Tweezer top
Two matching highs
What it is. Matching highs: the same price was rejected twice.
When it fails. In a strong uptrend repeated highs are usually accumulation before a break.
How to use it. Confirm with a close below the pattern's low.
Morning star
Down, pause, strong up
What it is. A big down candle, a small indecisive candle, then a strong up candle: selling exhausted and buyers stepped in.
When it fails. It fails when the third candle closes only marginally up, or when it forms below a heavy supply area.
How to use it. Look for the third candle to close above the midpoint of the first.
Evening star
Up, pause, strong down
What it is. A big up candle, a pause, then a strong down candle: buying exhausted.
When it fails. Fails when the pullback is shallow and the uptrend resumes within a few candles.
How to use it. The third candle should close well into the first candle's body.
Three white soldiers
Three strong up candles
What it is. Three strong up candles with higher closes: sustained buying.
When it fails. Late in a move it often marks exhaustion rather than a fresh start, especially with long upper wicks.
How to use it. Better as trend confirmation after a base than as an entry after a long run.
Three black crows
Three strong down candles
What it is. Three strong down candles with lower closes: sustained selling.
When it fails. By the third candle the move is often extended, so chasing it is the common mistake.
How to use it. Use it to confirm a change of character, then trade the retrace.
Piercing line
Down candle, then a close past its midpoint
What it is. A down candle, then an up candle that opens lower and closes back above the midpoint of the previous body.
When it fails. Weaker than a full engulfing; it fails when the close stops short of the midpoint.
How to use it. Measure the midpoint before deciding: that single detail separates it from a failed bounce.
Dark cloud cover
Up candle, then a close back under its midpoint
What it is. An up candle, then a candle that opens higher and closes back below the midpoint of it.
When it fails. Fails when the close is above the midpoint, which makes it just a normal pullback.
How to use it. Strongest at resistance with the stop above the higher open.
Bullish harami
Small up body inside the last big down body
What it is. A small up body sitting entirely inside the previous large down body: selling pressure suddenly shrank.
When it fails. The inside candle means indecision, not strength; many haramis simply continue lower.
How to use it. It is an early warning. The trade is the break of the harami's high.
Bearish harami
Small down body inside the last big up body
What it is. A small down body inside the previous large up body: buying pressure shrank.
When it fails. Frequently just a pause in an uptrend.
How to use it. Wait for the break of the harami's low before treating it as a turn.
Three inside up
Harami, then a close above the pattern
What it is. A bullish harami followed by a candle that closes above the whole pattern, confirming it.
When it fails. Fails when the confirming candle closes back inside the range on the following bar.
How to use it. This is the confirmed version of the harami, which is why it is more reliable.
Three inside down
Harami, then a close below the pattern
What it is. A bearish harami plus a close below the pattern, confirming the turn.
When it fails. Same weakness in reverse: a close back inside the range kills it.
How to use it. Use the pattern high as the stop.
Rising three methods
Big up candle, small pullback, new high
What it is. A strong up candle, a few small pullback candles that stay inside its range, then a new high: the trend paused and resumed.
When it fails. It fails the moment a pullback candle closes below the big candle's low.
How to use it. One of the few genuinely useful continuation patterns; the big candle's low is a natural stop.
Falling three methods
Big down candle, small bounce, new low
What it is. A strong down candle, a shallow bounce inside its range, then a new low.
When it fails. A close above the big candle's high invalidates it.
How to use it. Trade it as continuation with the stop above the pattern.
Context beats the pattern
A hammer in the middle of nowhere means little. A hammer that forms after price sweeps below an obvious low, at a support level, in a higher-timeframe uptrend, tells a much clearer story. Before acting on any candle, ask three questions:
- Where did it form? At a meaningful level, or mid-range?
- Which way is the bigger trend pointing?
- What confirms it? A follow-through candle, a break of the recent high or low?
How to actually learn them
Reading a cheat sheet is step one. Recognition comes from seeing hundreds of examples on real charts until you spot them without thinking, and seeing the ones that fail so you stop trusting patterns out of context.
Frequently asked questions
What are the most reliable candlestick patterns?
No pattern is reliable on its own. Engulfing candles, hammers and shooting stars at key levels, in the direction of the higher-timeframe trend and with confirmation, are among the most widely used.
How many candlestick patterns are there?
Dozens have names, but most traders focus on around 15 to 20 core single, double and triple candle patterns.
Do candlestick patterns work in forex?
They describe price behaviour in any market, including forex. Their usefulness depends on context: location, trend and confirmation.
What's the difference between a hammer and a hanging man?
They have the same shape. A hammer forms after a decline and hints at a bullish turn; a hanging man forms after a rise and warns of weakness.
Keep learning

Knowing the names is easy; spotting them in a live chart is the skill. Chart Bound's creatures and trials are built around these exact candles.
Play free, no signup →